Interactions and Filtering
In order to filter presentation elements in runtime, you must create interactions between the relevant assets. Interactions can be added from slicers to data discoveries in order to filter the discovery by an element selected from the slicer. Interactions can also be configured between data discovery visuals, to enable cross-visual filtering and highlighting, where a selection from one visual is used to filter or highlight elements in the visual(s) with which it shares the interaction. Interactions can also be created between multiple slicers to facilitate cross-slicer filtering and highlighting; in this scenario, a slicer selection has a cascade affect that flows to the other slicer(s) sharing the interaction.
Add Interactions
There a several options for adding data interactions from slicers. These options are available from the Home and Slide ribbons.

-
- Auto Interact: click Auto Interact to automatically add interactions to the presentation. To view the interactions that were added, click Show Interactions.
- Remove All: use this option to remove all interactions from the presentation.
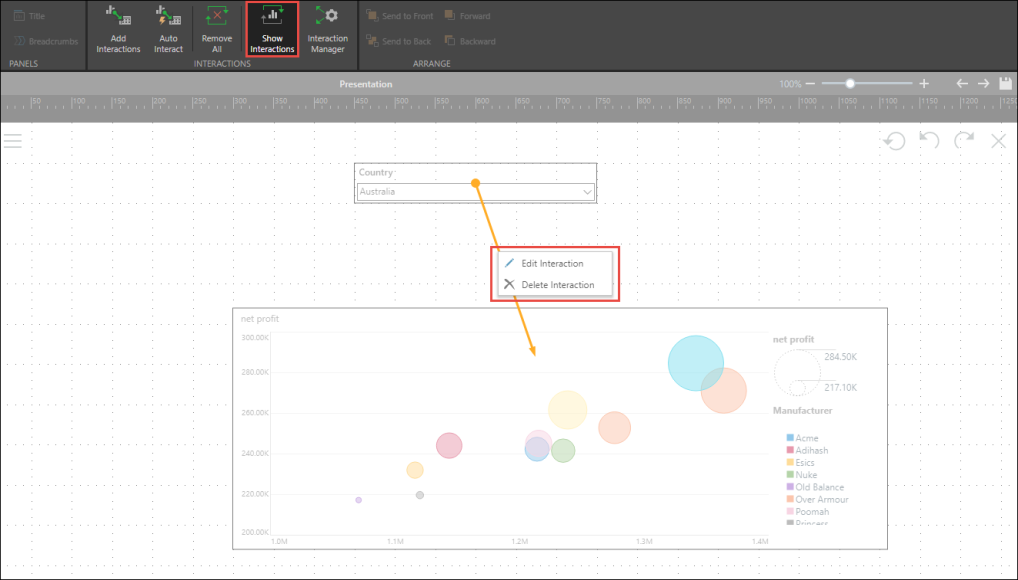
- Show Interactions: select to see all of the interactions that have been added to the presentation. Click the button again to disable it.
- Interaction Manager: open the Interaction Manager to manually define interactions. Options include defining data interactions or syncing interactions between visuals, to enable cross filtering of visualizations. See Interaction Manager for details.
Edit Interactions
To edit existing interactions, click Show Interactions and then right click on the interaction you want to edit. Select Delete Interaction to remove it, or Edit Interaction to edit it.
Selecting edit will open the Interaction Manager, where the interactions and settings can be edited.
Model Mapping
In order to utilize interactions between visuals, the hierarchy that is being used to filter or hierarchy must be labeled identically in each visual's data source. If both visuals were created from the same data model, this won't require any additional configuration. However, there may be instances where each visual queries a different data model, and the relevant hierarchy and/ or its member elements are not labeled identically in each of those data models. For example, 2 date hierarchies may have different date formatting applied to them. In this scenario, you can configure a cross-model mapping in order to map the corresponding hierarchies to each other; then they can be used in cross-filtering and highlighting, despite the different labeling conventions.